A web page is more than just a digital storefront—it’s a dynamic ecosystem of call to actions, engaging blog posts, intuitive design, and interactive forms, all working together to attract and convert visitors into loyal customers.
But building a beautiful website is just the beginning.
The real insights happen when you dive into understanding how visitors interact with your site. That’s where Google Analytics becomes the best tool for visualizing the user journey, which can help you identify opportunities to enhance your content strategy, and create an experience that drives sales and builds meaningful customer relationships.
We’ve created this post to help you understand what Google Analytics can track and monitor on your website, how to access these tools, and a case study that gives you an example of a customer journey analysis. Even if you don’t have any personal experience tracking customers on your website, this is a good starting point, so let’s go over the basics.
Google Analytics Is a Comprehensive Tool for Analyzing User Data
Data should always inform your decision-making in your business, or you risk wasting energy working in the wrong direction. It can help you assess your top-performing pages, see how people get to your consultation form, or identify broken links that are an obstacle to a user who is making their way through your website. Thankfully, Google Analytics allows you to track these things.
First, let’s break down some of Google Analytics’ actions that are relevant to the user journey.
Google Analytics provides various data on user behavior, such as:
- Pageviews–how often specific pages are visited;
- Session Duration–how long users stay on your site;
- Bounce Rate–the percentage of users who leave without taking action; and
- Exit Pages–pages where users often abandon the site.
For a Google Analytics customer journey, the Path Exploration tool helps visualize actions a user takes on a website, known as ‘events’, to leverage insights like:
- Your web page’s top-performing pages,
- Which backlinks are working,
- How users move across your site,
- Where users go after the homepage, and
- What URLs lead to your conversion pages.
It’s a great way to figure out if your website is converting clients. If not, it can also help you determine why.
![]() I have been following Juris Digital for years on social media and reading all blog materials to better understand the brand. Juris has an impeccable reputation for results and performance. Our firm needed a leader in the industry to showcase the firm and have a create/result mentality.
I have been following Juris Digital for years on social media and reading all blog materials to better understand the brand. Juris has an impeccable reputation for results and performance. Our firm needed a leader in the industry to showcase the firm and have a create/result mentality.
— Attorney Jay Rooth
Why Knowing the User Journey Is an Essential Part of Your Website Strategy
Simply put, tracking the user journey is important because it helps you challenge assumptions about your audience. While there are a lot of theories about how users act in certain situations, the only way to truly know is to observe their behavior. What may be true about a website’s usability for one business may not hold true for another.
This means that knowing the user’s pain points—where they fail to convert, backtrack, etc.—helps with optimization efforts. Instead of making generic changes to the website, you can make informed, targeted decisions meant for your specific users. This is key to improving the likelihood of conversions.
Another benefit of tracking the user journey is that it helps you figure out where your site traffic comes from. Is it from social media posts? What about paid ads? Knowing this information helps you update your strategy on other platforms. For example, if you’re getting great traffic and conversions on a page from a paid ad, you may want to commit more of your marketing budget to paid ads. This can significantly increase your ROI.
How to Set Up A Google Analytics Account
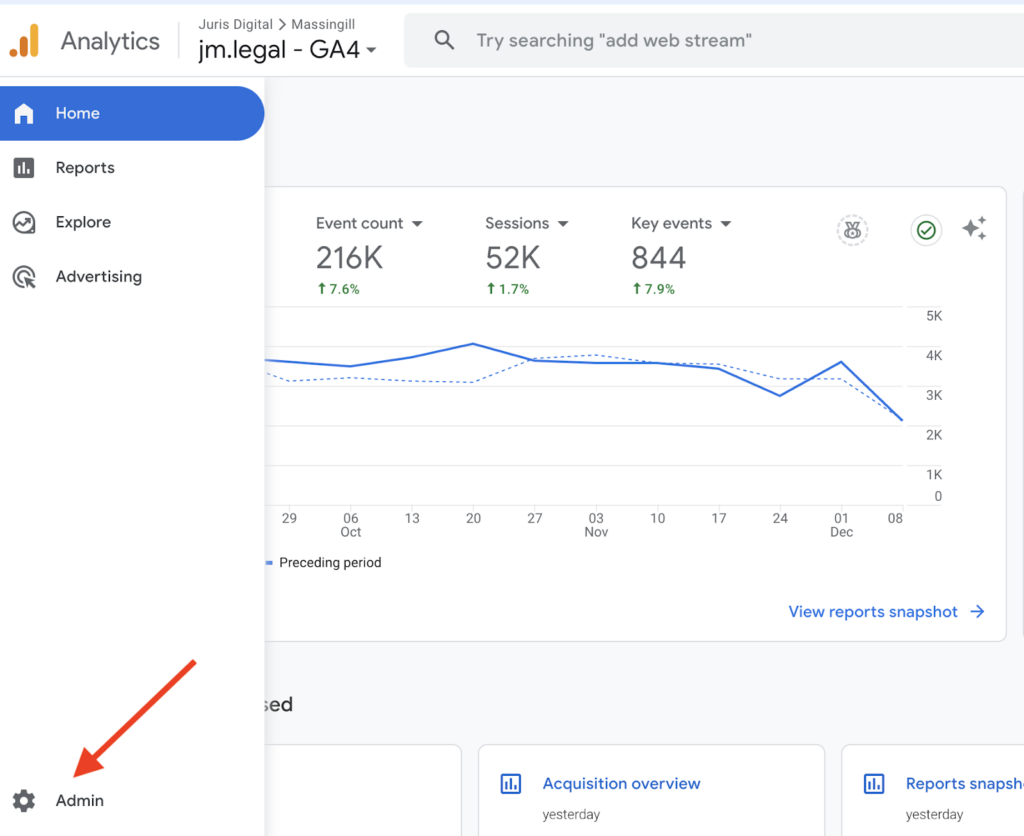
In case you don’t already have your website set up in Google Analytics, it’s a quick couple of steps before you’re ready to go. First, visit https://analytics.google.com, then head to Admin.
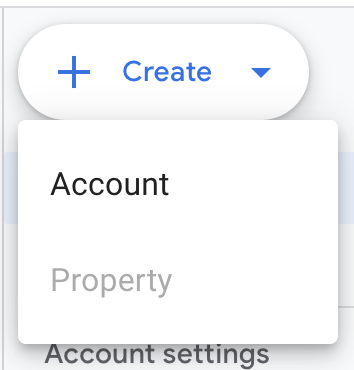
Then click Create.

Then, go to Account, where you’ll be brought to the creation form.
Create a name and choose whether you want this account to be a part of your previous organization or not so you can control who has access to it.

Next, we’ll show you how to access the Path Exploration tool for your user journey analytics.
How to Track the User Journey in Google Analytics
Tracking the user journey in GA is pretty straightforward. However, it does require you to set up a Path Exploration, which shows you the steps that users take as soon as they start a session.
Setting Up a Path Exploration
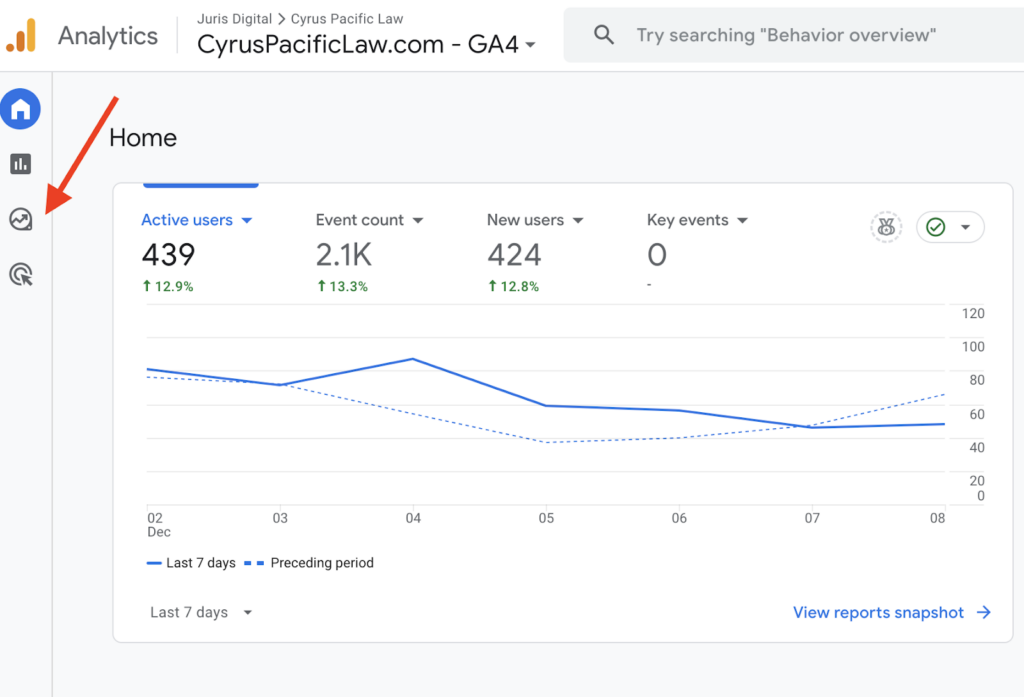
If you’re not sure how to track the user journey in Google Analytics, follow this step-by-step guide to get to the Path Exploration page. First, you will see a sidebar of icons. Choose the third icon down.
The sidebar will open up. Click on Explore.

For this exercise, click on Path Exploration to go to the data page.

A quick note: Once you’ve started doing some data analysis, you should be able to find it more easily on the homepage under Recently accessed.

In this section, you can see data from users in a particular region, like the US for example, or check for events like broken links across your web page. You can also get a more direct Google Analytics customer journey by starting with your ending point—like your consultation page—and doing a reverse user journey.
Case Study: Customer Journey Analysis for Massingill Law
Let’s break down what a Google Analytics user journey could look like using one of our client’s web pages. If this is your first time doing any sort of customer journey tracking on Google Analytics, you might want to start with your top-performing page to see a general overview of how your users are behaving. Tracking users on a page with little to no traffic won’t offer any conclusive results, if any.
For this client, Massingill, their top-performing article is ‘How to Check Business Name Availability in Texas.’

This page had 3,680 visitors, with the parameters set to the last 7 days. You can do 30, 90, or custom timeframes, depending on what your needs are. By clicking on that node, the system will open up the next step, which maps where your users are going after. It’s labeled as steps in the Path Exploration, so you can easily keep track of where users come and go.
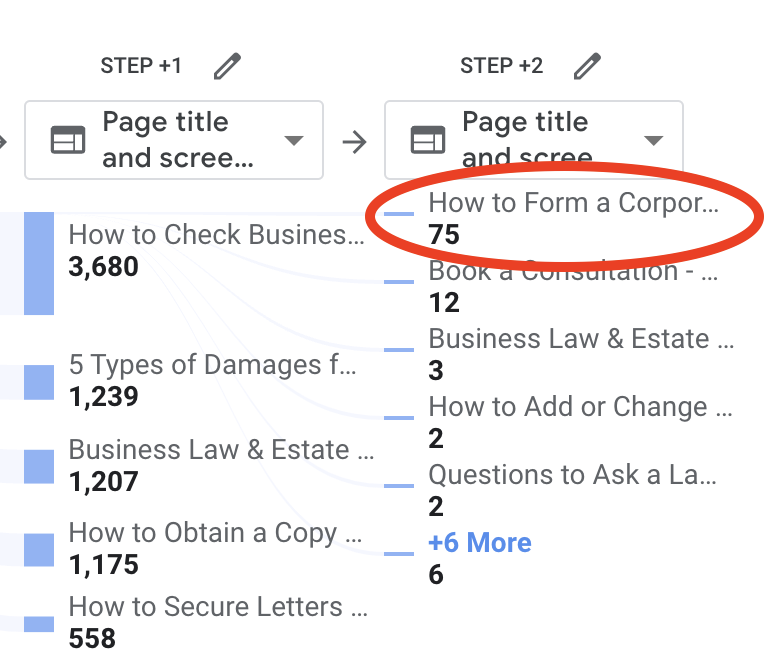
From this example, we see that users’ actions were dispersed, though most of the ones that moved to another page—75 people to be exact—ended up on the article ‘How to Form a Corporation in Texas: A Quick Guide.’ However, only 12 people clicked on the Consultation Form, meaning visitors who are reading that first page aren’t quite ready to convert. On this page, the conversion rate is well below 0.5%.
In the next step, you might expect that users will continue their journey through your website, making their way across different articles that you’ve strategically backlinked before finally converting. Instead, 40 users make a surprising next turn. They go back to the original article.

There are a few reasons why a customer might click the back button on an article:
- The page had technical issues, like a long load time;
- Users aren’t ready to engage with the material;
- Users aren’t seeing a clear call to action; or
- There are broken links.
After looking at the article’s layout, my theory is that, in this particular case, the backlink is much too high in the article. The backlink is in the second paragraph, which makes the reader jump ahead to another article without really contextualizing the information they’re reading.

While we aren’t exactly sure, what we do know is that this article, while garnering a lot of traffic, isn’t converting as much as it could. This data allows us to think about what tweaks and changes we can make, drawing on information about customer behavior, UX design, and what we know about our ideal client. In short, it helps you identify pages where content needs to be refreshed or optimized.
As we continue our customer journey tracking, we see that some articles, such as ‘Texas Affidavit of Heirship’ convert clients faster.


While this article has less traffic, it has a decent conversion rate for an informational piece, sitting at around 1.2%. That’s 4x higher than the previous page we looked at.
Now, this could be for a couple of reasons. First, it could be due to the fact that the first links on this article are a practice area page and a direct call-to-action. However, it could be converting more because users who visit this page are much closer to the end of the funnel than someone looking up how to form a corporation.
This context is essential to understanding user behavior on your website. It also gives insights into what users you should be targeting. Generally, the closer a user is to the bottom of the funnel, the closer they are to booking a consultation.
After doing some more digging, we see that the fastest converting page is the homepage, which sits at 6.7%. This suggests a customer who is moving from the homepage to the CTA is already farther along in their decision-making process:

If we wanted to analyze the direct path from a certain ending point—let’s say starting at the consultation page and working backward—we can also do that using the Path Exploration tool.
First, click Start over to create a fresh path.

Then, you’ll have the option to enter a Starting Point or Ending Point. This time, we’ll want to enter an ending point.

Before choosing the page, click Page title and screen class. You can also choose page path and screen class if you would prefer to see the slug of your web page.

It will give you an option to choose which page. For this example, we want the consultation page.

Now that the consultation page is set, you can reverse-map the customer journey analysis, going as far back as 10 levels to discover the different starting points, giving you greater insight into how users move across your site.

Final Thoughts
We’ve given you a brief rundown of two of the simplest methods for tracking users on Google Analytics, but the tool is robust and can offer many more specialized insights depending on what information you need. You can set different starting and ending points, track how many times people fill out and send a consultation form, or track from a particular region.
Still Need a Little Help? Let’s Talk About You and Your Firm’s Goals
If tracking data on Google Analytics doesn’t seem like a task you want to do, why not leave it to Juris Digital? We believe all good marketing strategies are data-informed and human-driven, so if you’re ready, reach out to us today and let us handle the tracking while you get back to what you do best—serving your clients.
Ready to Elevate Your Law Firm’s Marketing?
Let’s Talk