 Is my law firm SEO agency doing their job? Is my website doing its job?
Hint: You can check yourself…
Did you know that you don’t have to be a Google Analytics expert to be able to quickly answer this question? In this post we’re going to look at how to use Google Analytics to gain a fundamental understanding of whether your website is producing valuable traffic for your law firm, and if it’s not, what you can do to take action.
Here are five tips you can use to evaluate the performance of your website in Google Analytics.
Tip #1: Check Goal Conversion Pages
If you don’t have goal tracking setup in Google Analytics you’re missing out on key data that could help you make better decisions about where you invest your digital marketing dollars. Goals in Google Analytics allow you to track an event that takes place on your website. An event can be a number of things including but not limited to:
- A contact form was filled out on your website
- Someone on a mobile device clicked your phone number to call you
- A live chat was initiated
- You have a new newsletter subscriber
If you have goal tracking properly set up you can pull loads of information right from Google Analytics such as:
- Which specific pages produce the most leads
- Which pages don’t produce any leads
- Which traffic sources result in the most leads
- What is your cost per acquisition
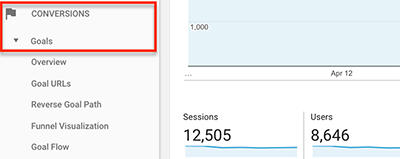
To see if you have this setup for your website, open up Google Analytics and on the left side click Conversions > Goals > Overview page.

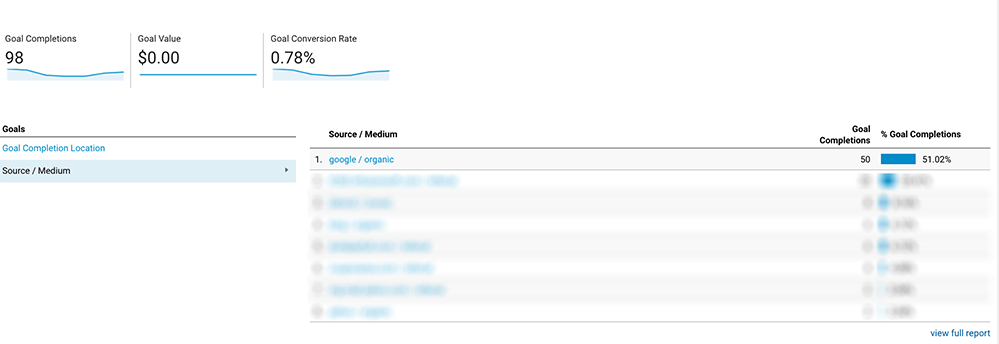
From here you can click Source / Medium and see which channels produced the most conversions. If you look at the example below we have a total number of goals and a conversion rate report from the sources. Google Organic was the top performer accounting for over 50% of the goal completions in the example below.

If you see sources or pages that are not producing conversions, you can determine what efforts are justified and which need more work or tracking. Make sure you have goal tracking setup with the KPI’s that are most important to your business.
Tip #2: Check your landing pages. Are they getting traffic?
If pages aren’t getting website traffic from Organic search results you should figure out why. There are a million and one reasons that they may not be performing including but not limited to:
- The page isn’t ranking in Google
- There is no search volume for the keywords it’s ranking for
- There is keyword cannibalization on the website
- There is topical dilution
- and the list goes on…
But don’t let that deter you. The first step in solving a problem is recognizing that there is an issue. So let’s start by seeing which pages are not performing on your website.

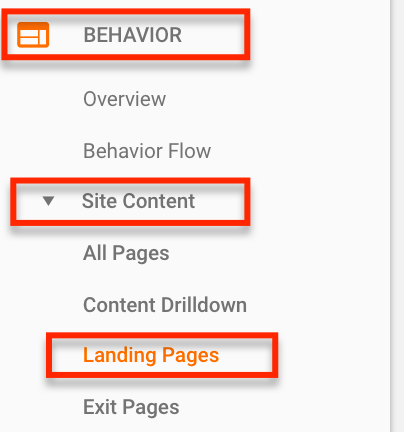
To access this simply pull up Google Analytics and go to Behavior > Site Content > Landing Pages to get access to all of this fun data.
Once you pull up this report you will be given a vast amount of information to sift through. Here are the fields you should pay attention to:
- Landing Page: This is the URL of the page you’re looking at
- Bounce Rate: This will show you which visitors only visited 1 page and then left your website.
- Goal Conversion Rate: This is the conversion rate for the page
- Goal Conversions: This is the number of conversions as they relate to a goal.
As you can see in the example below, we can easily identify which specific pages are converting for you instead of just the source of the traffic, along with boatloads of other useful information, all in one screen.
One of the reasons I use this view is to see which pages are not getting landing page traffic. According to Google Landing Page traffic is “The webpage where people end up after they click your ad. The URL of this page is usually the same as your ad’s final URL.”.
In other words, this is the first entrance to your website. If you have pages that are not getting landing page visits they either don’t deserve to rank, don’t need to rank, or are just not performing. You can easily find these by clicking the sessions arrow and sorting the data.

Once you’ve sorted the data check out which pages have no or very few visits. You will then want to prioritize the work needed on these pages to get them ranking and performing.
Tip #3: Check Your Page Site Speed
Analytics has tons of great and useful info. Another potential major problem that can cause your website’s performance to suffer is page load timings. If a page takes too long to load your website visitors are probably leaving your website.
Our goal here is to look for outliers and long page load times. If you see a lot of load times over 3 seconds you will want to address these. To find this report, surf to:
Behavior > Site Speed > Overview
This will provide a snapshot of page load times by browser type. You can see in the report below that most of these load times are over 3 seconds with a big outlier with Safari.

Finding this data shows that we need to make improvements. If you want to take this a step further you can visit Audience > Technology > Browser & OS and sort by goals. Do you see lower goal percentages based on slower loading browsers? If so, this is a problem that needs to be addressed!
Tip #4: Check Out Your Website Visitors
Sometimes people like to report on overall traffic numbers as a sign of success. My issue with this is that anyone can visit your website, but if your law firm only serves clients in Los Angeles, California the traffic from Russia may not be super useful to you. At any rate, one way to check the health of your website visitors is to see where they’re coming from.
The goal here is to see if you need to increase traffic from certain regions more effectively. This is also a great way to audit your PPC campaign to see where the traffic you’re paying for is coming from.
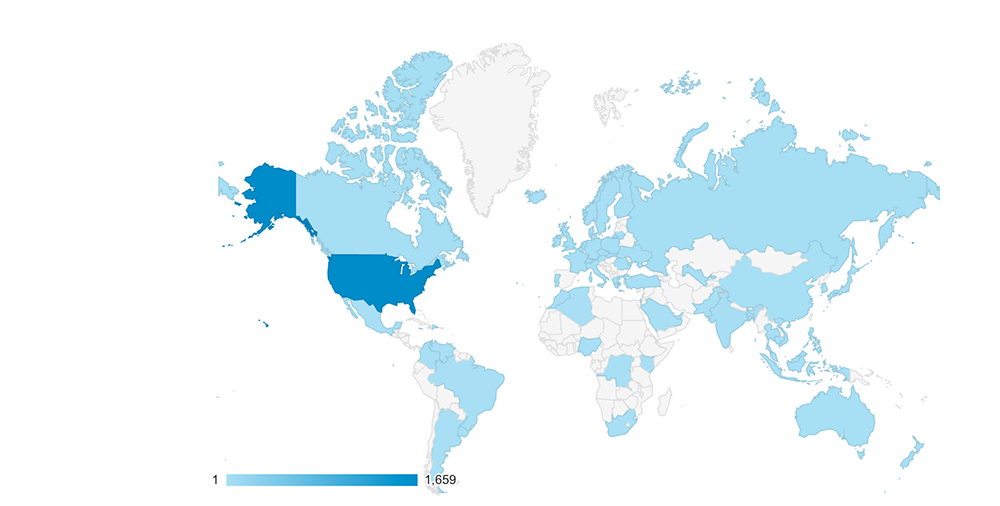
To access this data simply visit Audience > Geo > Location where you will be presented with a handy map like the one below.

If you’re not an international brand you should see low visitor counts from visitors outside the US. To see where your visitors are coming from simply hover over the country and a number will appear. This is the number of visitors from this location on a given period.
Tip #5: Check For Page Load Issues
Another handy tip to take advantage of in Google Analytics is to check for potential page load issues. The best way to figure this out is to review the traffic by the web browser and see if the conversion rates are similar from a specific traffic source.
For example, in the report below I pulled a Browser & OS report and added a secondary dimension of Source and Medium filtered to only show Google Organic traffic.
The result is a report that shows the conversion rates for each browser type. Interestingly enough we can see that Google Chrome seems to have the lowest conversion rate from this report which is something we will want to dive into further.

To create this report start by going to Audience > Technology > Browser & OS. Once you’re here follow these steps:
- Click on the secondary dimension button underneath the graph and start typing source.
- Once you see Source / Medium you will want to select that option
- Then click the advanced blue link towards the right of the screen
- Under the Include option that pops up by default select source/medium here again
- In the box to the right of the word “containing” enter Google and select the Google / Organic option.
This will give you access to the same report I created above to easily check out potential browser issues by conversion rates.
There Isn’t Much Google Analytics Can’t Do
If you know what you’re looking for there isn’t much that Google Analytics can’t do. If you have a website its worth investing in getting Google Analytics setup correctly to track the KPI’s which are most important to your firm.
Collecting website data is essential to the overall success of your SEO project and will allow you to make data driven decisions for your business to get more clients.
